Starting with iOS 14, collecting IDFA requires user consent. If you want to measure ads, you need to ask for permission up front.
IDFA (Identifier for Advertisers)
Apple’s device identifier used for measuring ad engagement and conversions.
Reference: https://www.adjust.com/ja/glossary/idfa/
ATT (App Tracking Transparency)
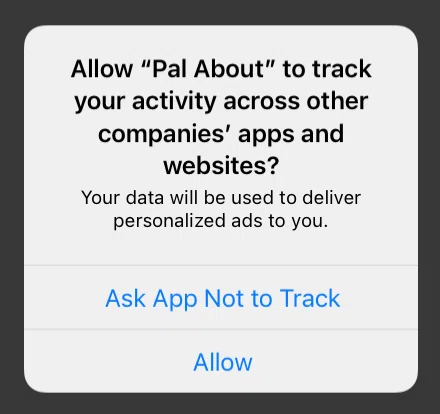
On iOS 14 and later, apps cannot obtain IDFA from users who haven’t granted permission. If you want to track for advertising, you must request IDFA consent.
Opt‑in
Explicitly asking users to allow tracking.
ATT opt‑in rate
Number of users who allowed tracking. According to this AppsFlyer article, the overall opt‑in rate is around 41% across apps, and about 28% per app. Non‑game apps tend to see higher opt‑in rates.
Reference: https://www.appsflyer.com/jp/ios-14-att-dashboard/
LAT (Limit Ad Tracking)
Before iOS 14, ad tracking was controlled by Limit Ad Tracking (LAT), which was an opt‑out model: IDFA was available by default unless the user disabled tracking.
LAT‑ON users
Users who enabled LAT.
What developers need to do
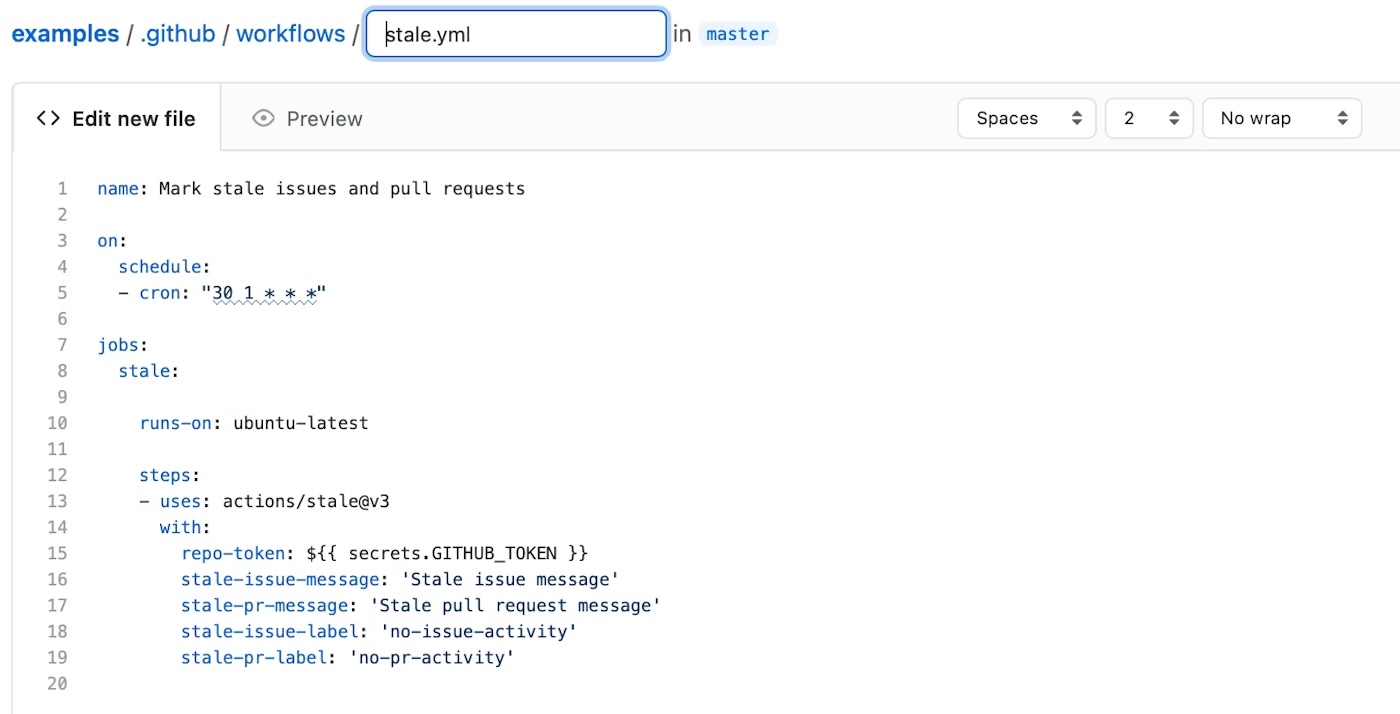
If you collect IDFA, add a Tracking Usage Description entry to Info.plist and provide user‑friendly copy for the prompt.
With opt‑in rates around 30–40%, craft the message from the user’s perspective.
(See: Five ways to increase ATT opt‑in rates)
In your app, request ATT permission at an appropriate timing for your UX.
Reference: https://zenn.dev/yorifuji/articles/ios-app-tracking-transparency
Note for React Native
If you measure ad performance using something like AppsFlyer, configure iOS 14 ATT handling; otherwise non‑organic attribution won’t work.
AppsFlyer attempts to obtain and send IDFA at launch; defer sending until after ATT is granted by setting
timeToWaitForATTUserAuthorization.
Use a library such as react-native-tracking-transparency to request permission.